These graphs show AQI values at a given time during the month of July 2023. These graphs are interactive and can be zoomed in to see data more clearly. A .csv file is also available for download below. Data was captured with 2 identical PurpleAir PA-II particulate sensors. These were loaned from the US EPA.
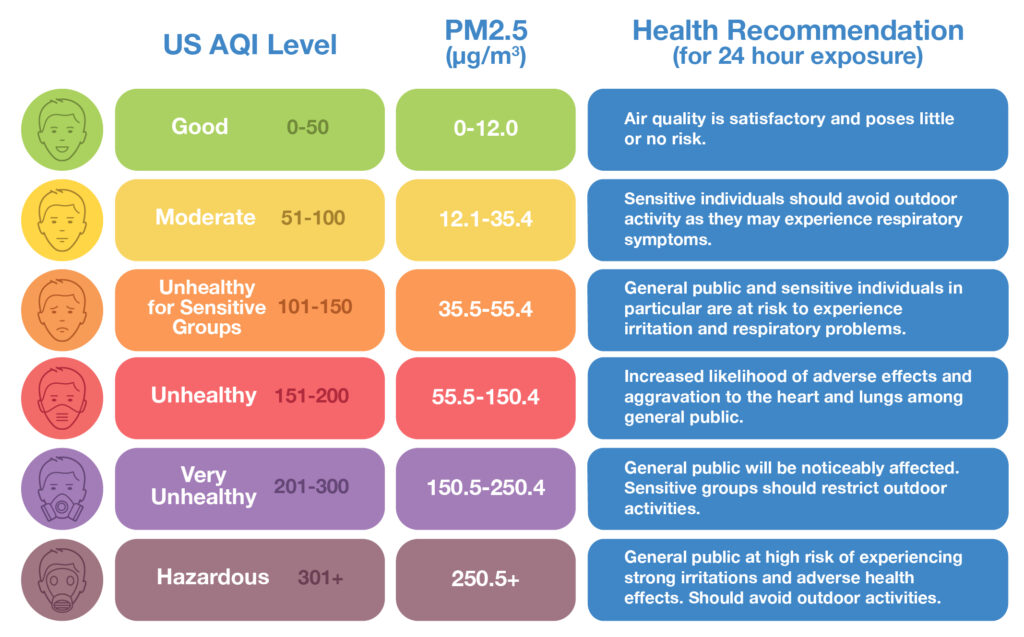
AQI (Air Quality Index) is a relative rating of air quality. Factors include particulate concentration, temperature, and humidity. Descriptions of each level are described below (lower is better).
There are 2 data sets in these graphs:
AQI Close: This data was taken outdoors at a home 150 ft away from the Factor facility. This home is considered to be one of the most affected in the neighborhood.
AQI Far: This data was taken outdoors at a home in the same neighborhood, approximately 650 ft away from the Factor Facility.
NOTE: If you are on a mobile device, try using landscape mode.
The air quality at each home mostly tracks together. However, there are periodic spikes in the AQI readings at the “close” home. Journals kept by residents nearby the facility show that noise, vibrations, strong odors, and bouts of sickness (respiratory problems such as coughing, headaches, nausea, dizziness, etc.) occur almost exclusively when these spikes are recorded.
Even when the Chicagoland area was affected by wildfire smoke, spikes can still be witnessed at the “close” home.
